Form Analytics Dashboard
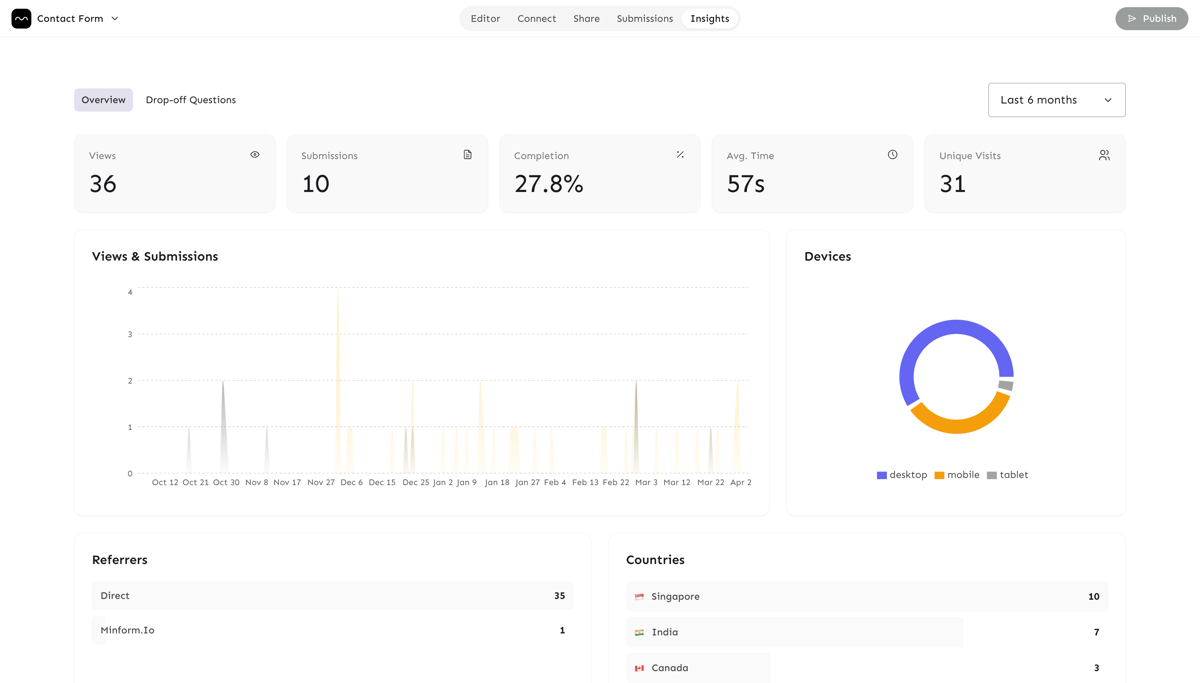
Instantly see how your forms perform - views, submissions, completion rate, average completion time, and unique visitors, all visualised in a clean interface.
Metric | Description |
|---|---|
Views | Total page loads of the form. |
Submissions | Number of completed responses. |
Completion Rate |
|
Average Time | Mean time (seconds) taken to finish the form. |
Unique Visits | Distinct visitors, deduped by |
Accessing the Dashboard
- Open your form in the Minform editor.
- Click the Results tab.
- Switch to Insights to view the analytics.
Date‑range Filters
Pick a preset range or select a custom window:
- Today : activity from the current day.
- Yesterday : previous day.
- Last 24 h : rolling 24‑hour window.
- Last 7 d : weekly view.
- Last 30 d : default monthly overview.
- Last 3 mo : quarterly trends.
- Last 6 mo : long‑term patterns.
Chart Guide
Views & Submissions Over Time
Area chart showing daily totals. Use it to spot traffic spikes, campaign impact, or form‑level changes.
Device Breakdown
Pie chart of device categories:
- Mobile
- Desktop
- Tablet
Referrers
Top sources driving traffic (Google, Direct, Social, etc.).
Countries
Geographic distribution with flags - helps you gauge global reach.
Browsers & Operating Systems
Separate pie charts for browsers (Chrome, Safari, Firefox, Edge) and OS's (iOS, Android, Windows, macOS). Useful for compatibility testing.
How Data Is Collected
- View - recorded when the form loads; a unique
visit_idis generated. - Submission - recorded on form submit and linked back to the originating
visit_id.
Each visit_id stores:
- Device type, browser, OS, and country.
- Referrer URL and source.
- Optional UTM parameters (
utm_source,utm_medium,utm_campaign).
Privacy note: No personally identifiable information (PII) is stored in analytics. All data is aggregated and anonymised.
Getting the Most Out of Your Analytics
- UTM tagging - add
utm_*parameters to your form URLs to track campaigns. - Watch completion rates - low rates may signal confusing questions or a long form.
- Device focus - if most traffic is mobile, prioritize responsive design and fast load times.
- Geography - consider localization for countries with high traffic.
- Compare periods - toggle date ranges to see month‑over‑month growth or campaign impact.
What’s Not Tracked
- Individual response content.
- Personal data (names, emails, etc.).
- Question‑level interactions (planned for a future release).